Published on: 02/17/2022
In the previous post, we discussed the challenges in understanding fluid properties related to the high CO2 concentration in the mixture composition. This issue may cause the formation of a second liquid phase rich in CO2 and, consequently, a Vapor-Liquid-Liquid Equilibrium (VLLE) and/or a Liquid-Liquid Equilibrium (LLE). These phase equilibria strongly affect the mixture’s physical, thermal, and transport properties, such as density, viscosity, and Joule-Thomson coefficient.
ESSS’s Fluid Analysis and Simulation Environment, RF-DAP FASE, was used to demonstrate the phase equilibria of these fluids and to predict their properties in order to describe the challenges and the impact of them on flow assurance.
To define a fluid mode for this casel, a synthetic fluid composition was used (Figure 1). This mixture contains approximately 76% CO2, so it is expected to exhibit strong CO2 effects. The light components represent approximately 19% of the total composition.
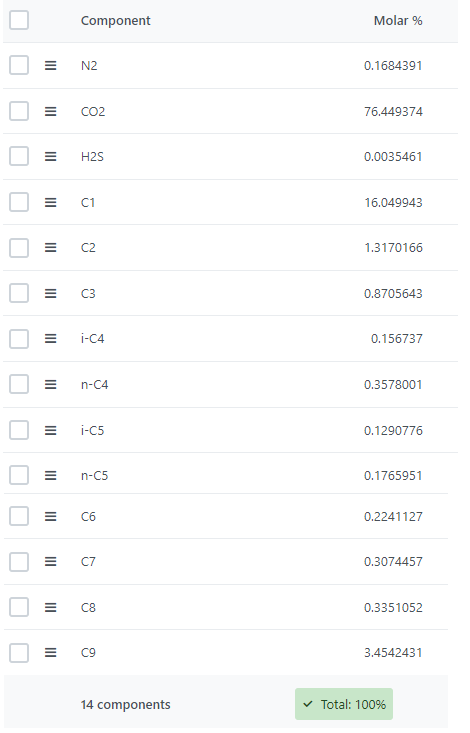
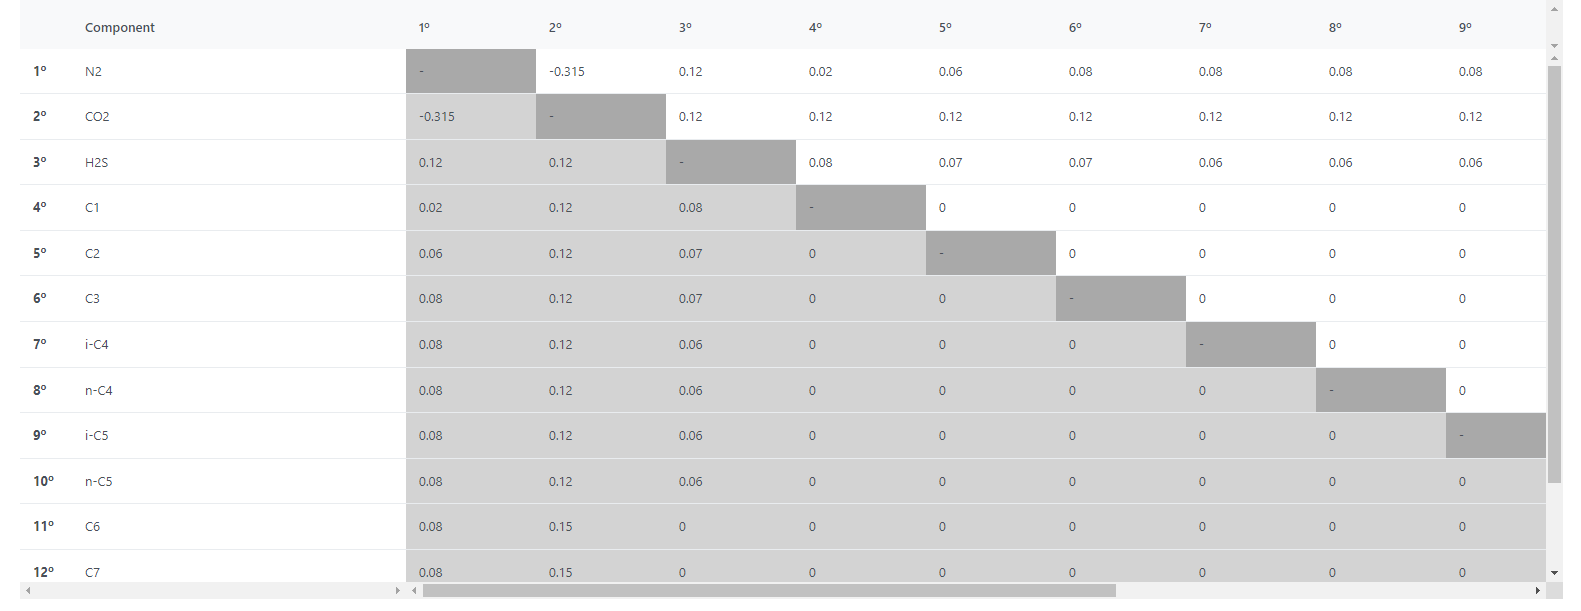
The fluid also contains impurities: 0.0035% of H2S and 0.168% of N2 content. Default binary interaction parameters (BIPs) for the classical van der Waals one-fluid mixing rules were considered, and the values are presented in Figure 2. The Peng-Robinson equation of state was used in order to determine the phase equilibrium of the fluid.
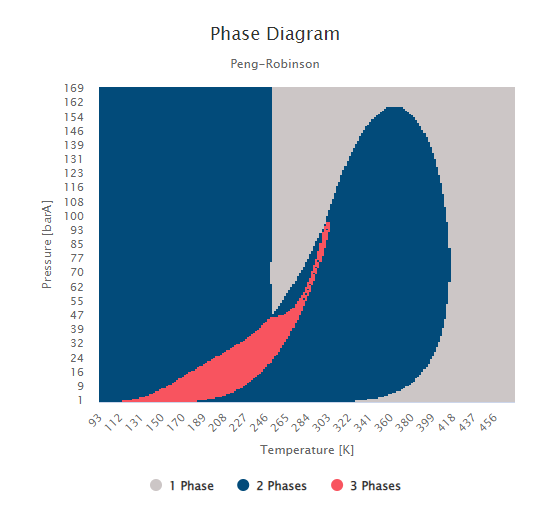
After successfully simulating this case, the phase diagram was analyzed (Figure 3), and shows a narrow three-phase region, between 1 and 90 bar and between 100K and 300K, as expected from the effects of high CO2 content. In this region, a vapor phase, a liquid phase rich in CO2, and a liquid phase rich in hydrocarbons coexist. Moreover, this region is surrounded by two-phase regions. To identify if they represent a LLE or a VLE, let’s simulate and interpret the results of the thermodynamic properties estimates.
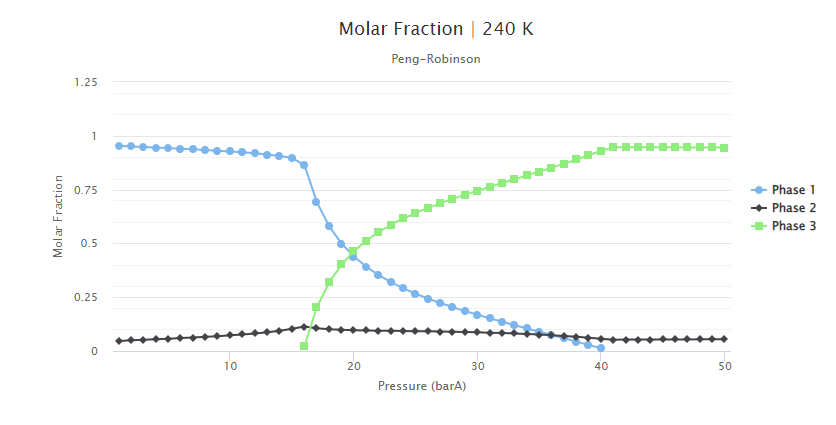
To understand the fluid behavior, a simulation of the phase properties was performed at 240K and between 1 and 50 bar. The molar fraction obtained is shown in Figure 4. As the pressure increases, a third phase appears, generating the three-phase region between 16 and 40 bar. When this new phase appears, the molar fraction of Phase 1 decreases until it is not part of the system, leading to a two-phase region.
Looking at the density curves obtained in Figure 5, Phase 1 is the phase presenting lower density values; thus, it represents the gas phase. Moreover, once Phase 1 disappears with the rise of pressure, an LLE occurs for pressures higher than 40 bar.
Furthermore, by analyzing the liquid density curves since Phase 2 is the one with lower density, it can be inferred that it is the liquid phase rich in CO2, while Phase 3 is the heavier liquid phase rich in hydrocarbons. Also, in the LLE region, the density of both liquids assumes similar values, leading to a ratio close to a unit. This behavior is typical for fluids with high CO2 concentration, impacting several areas during production, such as the flow rates of the pipelines and the volume of oil produced.

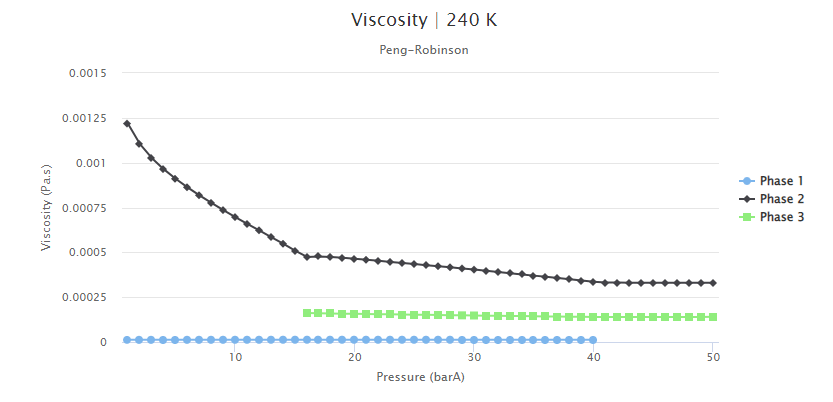
The predicted viscosity values are shown in Figure 6. These values were obtained using the Corresponding States Principle (CSP) model, without adjustments to fit with experimental data. The results describe that, for all phases, the viscosity initially decreases exponentially as the pressure increases. After reaching a minimum value of viscosity estimate, the viscosity then slightly increases with increasing pressure. This increase was expected as described in the previous blog post, and it may affect the recovery strategies in the field. Enhanced Oil Recovery (EOR) methods aim to reduce the fluid viscosity to improve the displacement of the fluids in the porous media.
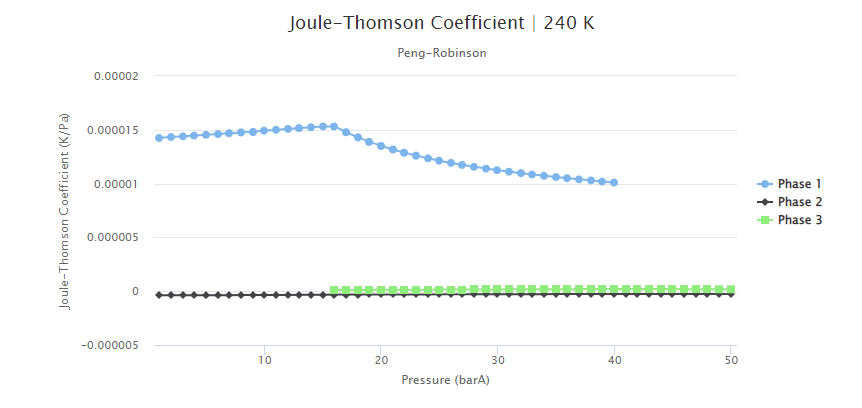
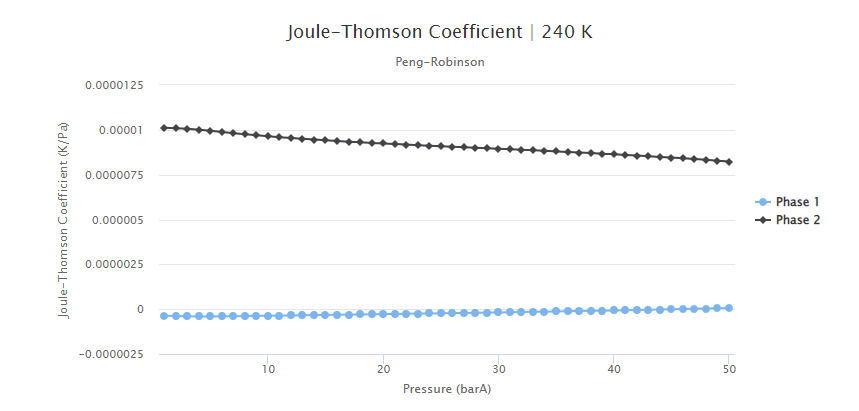
The Joule-Thomson coefficient values for this fluid composition are presented in Figure 7. It can be seen that this coefficient assumes higher values for the gas phase. Moreover, to analyze how the CO2 content impacted this property, the Joule-Thomson coefficient was estimated for a fluid that was similar but contained only 8% of CO2 (Figure 8). From this comparison, it can be interpreted that this coefficient assumes higher values for higher CO2 concentrations. As described in this past blog post, the stronger Joule-Thomson effects can lead to flow assurance issues, such as wax deposition and freezing of equipment and flowlines.
These significant effects of the CO2 content, found in the simulations using RF-DAP FASE, show that obtaining correct thermodynamic, physical, and transport fluid properties is essential to determine realistic predictions for several areas of production, including flow assurance issues, the design of pipelines, and the volume and time frame of oil production as well as the recovery strategy. To help O&G industry professionals properly characterize reservoir fluids with high CO2 content for petroleum fluids, we developed RF-DAP FASE, a fluid analysis and PVT simulation environment. By featuring the most up-to-date thermodynamic models, our software can accurately predict the phase behavior of complex petroleum fluids.