Published on: 02/02/2022
Currently, carbon dioxide (CO2) is a topic of interest in the Oil & Gas industry. For many decades, CO2 has been used in Carbon Capture and Storage (CCS) activities and as an Enhanced Oil Recovery (EOR) fluid when fluids with high CO2 levels are injected into the reservoir. More recently, the discovery of Brazilian pre-salt fields revealed petroleum fluids with high CO2 content.
The high CO2 content in hydrocarbon mixtures, as petroleum, brings several challenges, especially from a thermodynamic perspective. Under some conditions, these fluids may form a second liquid phase rich in CO2. Figure 1 below illustrates a phase envelope of one of these fluids. As the pressure increases, the vapor phase, which contains CO2 and light hydrocarbon gases, condenses into a second liquid phase, generating regions of Liquid-Liquid Equilibrium (LLE) and Vapor-Liquid-Liquid Equilibrium (VLLE).
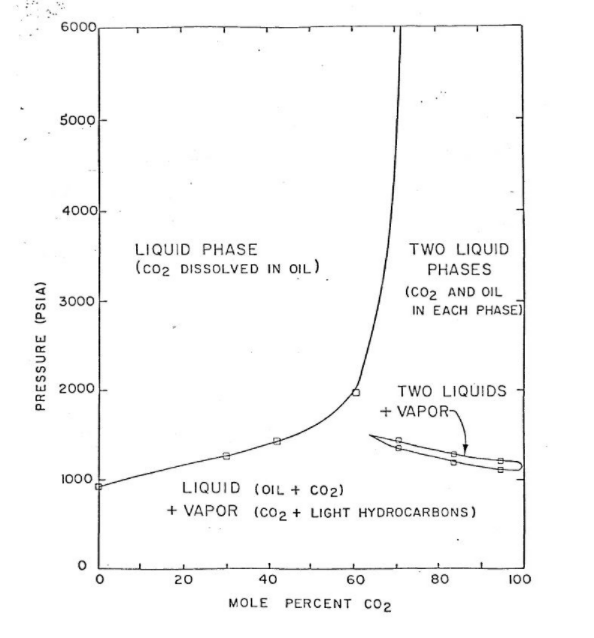
The thermophysical properties will be affected on a large scale by this second liquid phase.
The ratio between the lighter and heavier phase densities decreases and is close to a unit with increasing CO2 content and pressure; that is, both phases will have similar density values. This occurs because the high molecular weight of CO2, which is most present in the lighter phase, makes the phase density value similar as the heavier phase, even at moderate pressures [2]. This is illustrated in Figure 2, which shows the light-heavy density ratio for several CO2 concentrations obtained from numerical simulations.
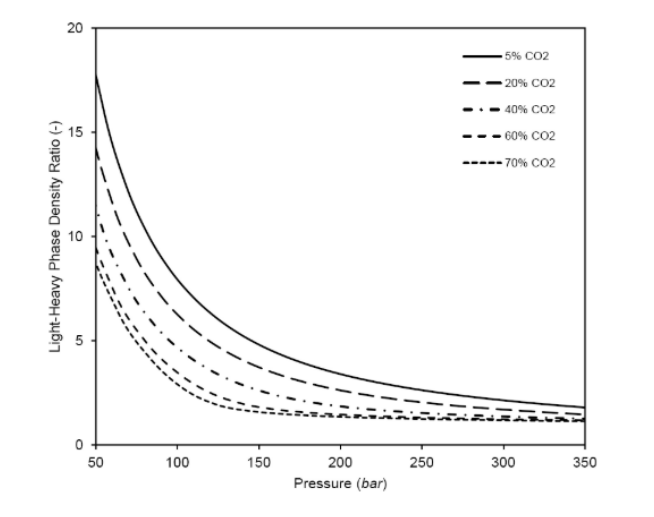
Figure 3 presents an example of viscosity measurements for a crude oil saturated with CO2 extracted from [3]. When a crude oil is saturated with CO2, the viscosity initially decreases exponentially as the pressure (or the CO2 fraction) increases. After reaching a minimum, the viscosity then increases at a low rate with increasing pressure. Therefore, as the CO2 solubility increases, the mixture’s viscosity decreases (Figure 3).
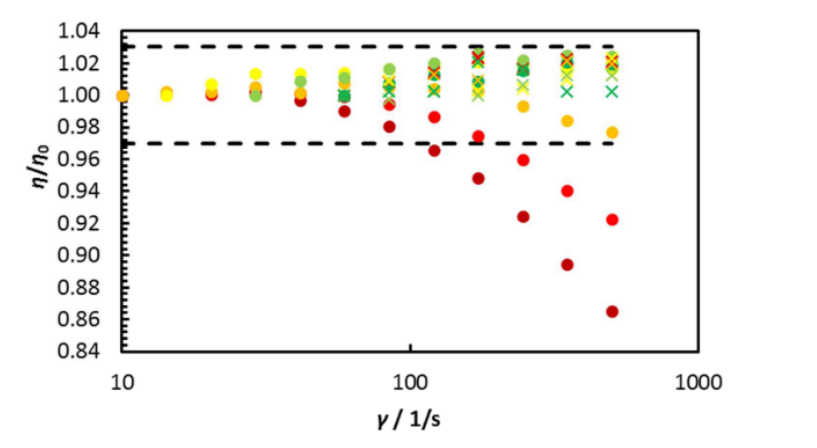
Moreover, crude oil mixtures have an anomalous viscosity dependence on density, whenever these mixtures are within the single-phase region [4]. When CO2 saturation increases, viscosity values decrease and density values increase. Inside the two- and three-phase region, however, this behavior does not happen. Once the second liquid phase has a liquid-like density, it has a gas-like viscosity. This can help the extraction of hydrocarbons into a dense CO2 phase.
As previously discussed, CO2-rich mixtures present regions where two liquid phases coexist.
Within those regions, these mixtures tend to have lower ITF values when compared with other hydrocarbon mixtures, especially at high pressures [5]. Notably, when the value is lower than the surface tension between water and air at standard conditions, it’s considered to have a low ITF.
The low IFT values increase the miscibility between the phases. This will create diffuse and ill-defined interfaces in the liquid-liquid region of CO2-live oil systems [6].
Figure 4 below shows values of the Joule-Thomson coefficient for pure CO2 and pure methane at different temperatures. Note that the CO2 presents significantly higher values. Thus, it can be inferred that this coefficient will assume potentially higher values as the CO2 concentration rises in hydrocarbon fluids.
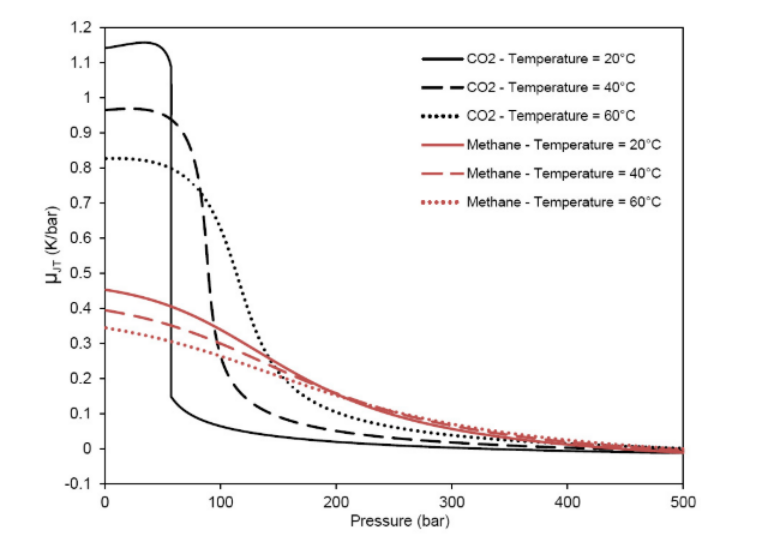
This significant variation can largely impact several aspects during the production of these fluids. When the Joule-Thomson coefficient is positive, a decrease of the temperature happens when a depressurization occurs. Thus, when this coefficient is negative, the temperature of the fluid increases with decompression. In general, this coefficient is negative for liquids and positive for gases. However, according to the initial pressure and temperature conditions, during the flow through the choke, the gas could be either cooled or heated. This variation of temperature might cause flow assurance constraints, such as wax and hydrate appearance, as well as freezing equipment and flowlines [2].
The understanding and knowledge of phase behavior and thermophysical properties of hydrocarbon mixtures with high CO2 levels have a fundamental role in predicting multiphase flow dynamics, such as pressure drop, holdups, and flow rates and temperatures in production, injection, and transportation lines, especially on transient production scenarios (e.g. shut-in, restart, and blowdown, among others).
To help O&G industry professionals properly characterize reservoir fluids with high CO2 content for petroleum fluids, we developed RF-DAP FASE, a fluid analysis and PVT simulation environment. By featuring the most up-to-date thermodynamic models, our software can accurately predict the phase behavior of complex petroleum fluids. If you’d like to learn more about RF-DAP FASE and ask for a free trial, just click here.
[1] Orr, F. M. et al. Carbon dioxide flooding for enhanced oil recovery: Promise and problems. Journal of the American Oil Chemists Society,. 59(10), p.810A–817A, 1982.
[2] Carneiro, J. N. E., et al. “Numerical simulations of high CO2 content flows in production wells, flowlines and risers.” OTC Brasil. OnePetro, 2015.
[3] Hu, R., Crawshaw, J. P., Trusler, J. M., & Boek, E. S. . Rheology and phase behavior of carbon dioxide and crude oil mixtures. Energy & Fuels, 31(6), 5776-5784, 2017.
[4] Lansangan, R. M., & Smith, J. L. . Viscosity, density, and composition measurements of CO2/West Texas oil systems. SPE Reservoir Engineering, 8(03), 175-182, 1993.
[5] Fu, D., & Wei, Y.. Investigation of vapor−liquid surface tension for carbon dioxide and hydrocarbon mixtures by perturbed-chain statistical associating fluid theory combined with density-gradient theory. Industrial & Engineering Chemistry Research, 47(13), 4490-4495, 2008.
[6] Ghorbani, M., Momeni, A., Safavi, S., & Gandomkar, A.. Modified vanishing interfacial tension (VIT) test for CO2–oil minimum miscibility pressure (MMP) measurement. Journal of Natural Gas Science and Engineering, 20, 92-98, 2014.