Published on: 09/29/2021
The main goal of reservoir and production engineering is to maximize the ultimate recovery of hydrocarbons in the most economical way and within the quickest time frame. Understanding how the fluid behaves in the reservoir conditions, through the process of pressure depletion, and until the fluid reaches the surface is fundamental in answering important questions, such as [1]:
During the development of oil and gas fields, the fluid produced is subjected to several conditions. As they travel from the reservoir, up to the pipelines, and then through surface facilities, the system’s pressure and temperature change. Along this process, the fluid composition, oil and gas volumes, and fluid properties such as density and viscosity will also vary.
In order to study how these volumetric changes will occur, several laboratory experiments are routinely conducted with reservoir oil samples in a PVT cell, reproducing the conditions that the fluids are subjected to during production. The most common PVT tests performed to characterize these reservoir fluids are:
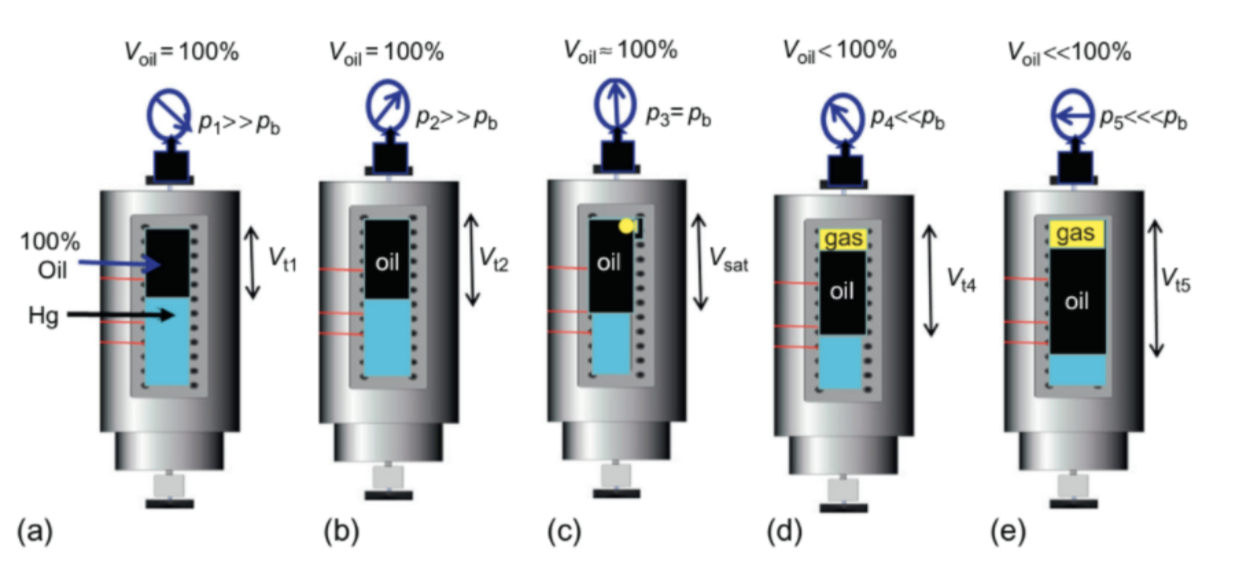
The CCE experiment, also called the Constant Mass Expansion (CME) experiment or simply a pressure-volume (PV) test, is performed on gas condensate or crude oil to investigate the PV relations of the system.
In this experiment, the fluid is kept at reservoir conditions, then pressure is depleted in steps at constant reservoir temperature, and the total hydrocarbon volume is measured at each pressure. No gas or liquid is removed from the PVT cell at any time throughout this experiment [2]. A schematic of the CCE experiment is illustrated below in Figure 1.
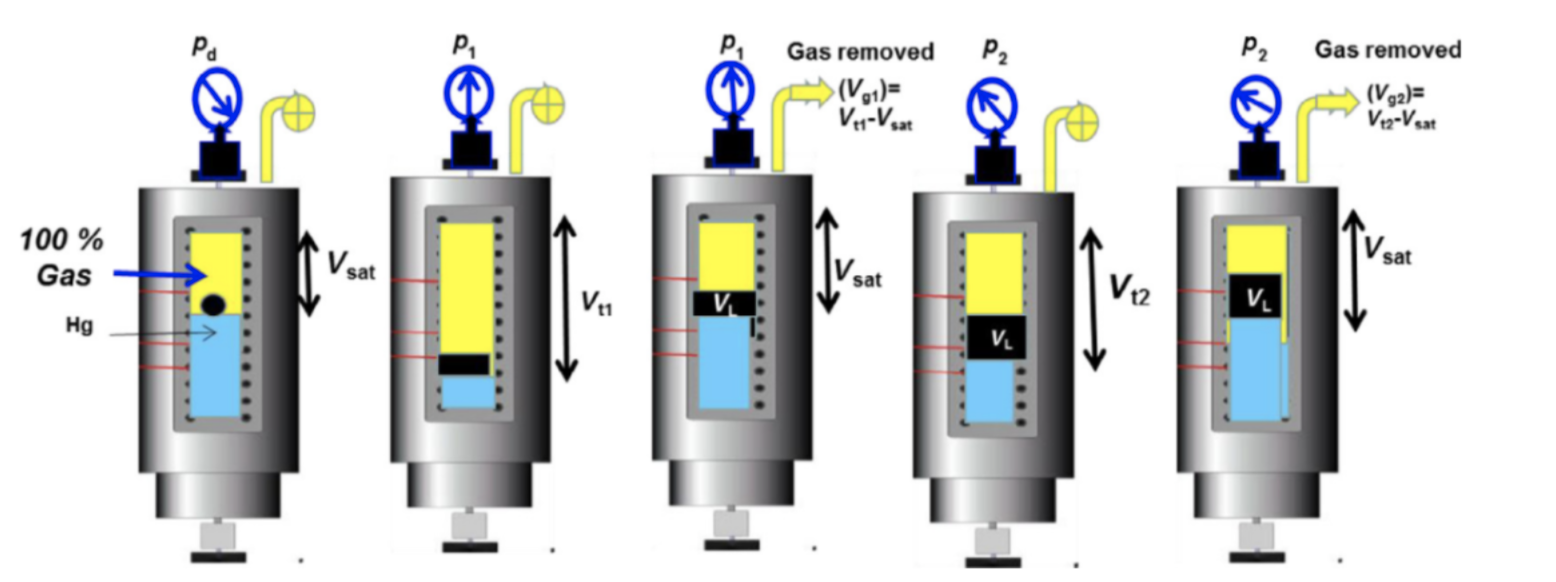
The CVD experiment is performed only for gas condensate and volatile oils mixtures, assuming that retrograde liquid appearing during production remains immobile in the reservoir.
The fluid is kept at reservoir temperature and saturation point pressure, and then pressure is depleted in steps at a constant reservoir temperature. At each pressure step, a second phase is formed and the total volume of the fluid is recorded. To achieve the next pressure depletion, mercury is injected into the cell, and the gas is removed so that the volume of remaining gas and oil mixture equals the saturation point volume [2]. Below a schematic of the CVD experiment is presented in Figure 2.
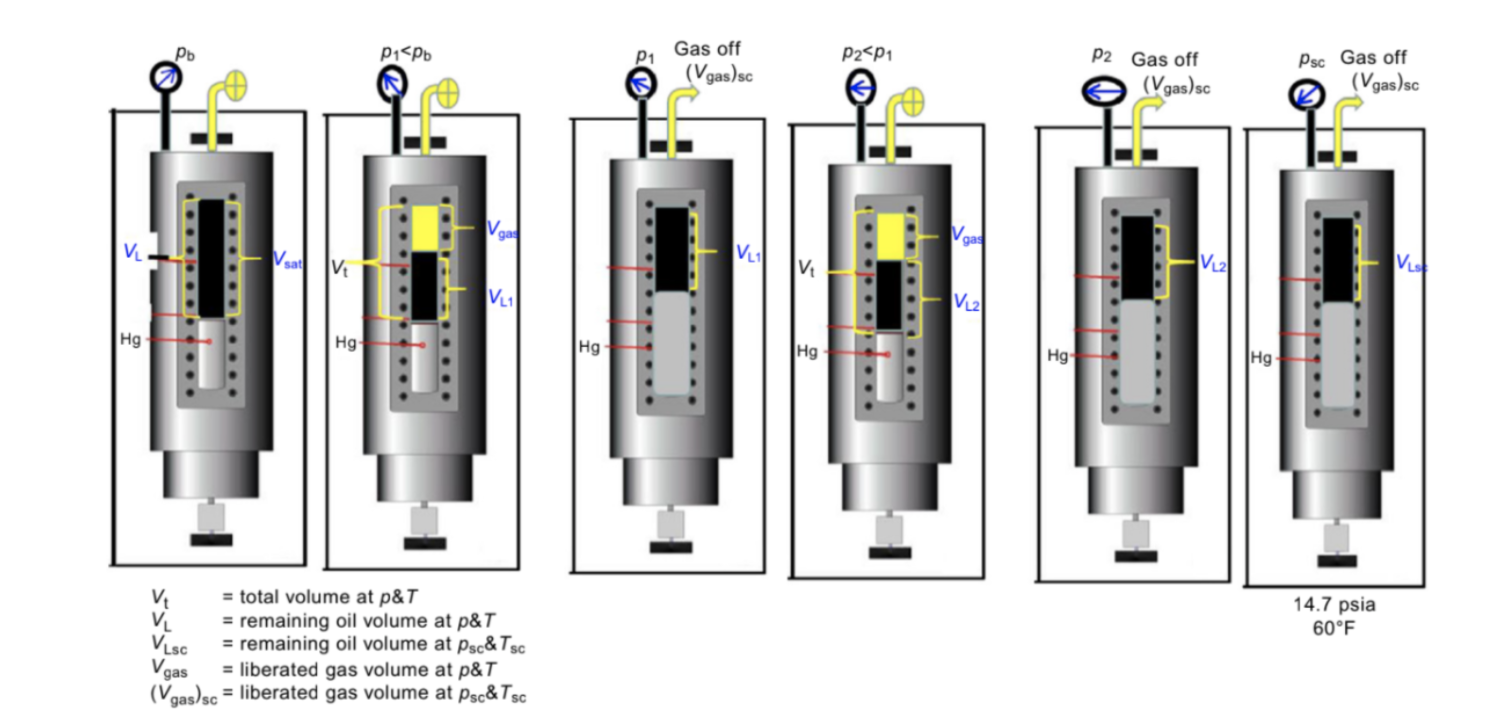
The differential liberation (DL) test is perhaps the most common laboratory experiment performed on crude oil samples. As in the CCE experiment, the fluid is kept at reservoir temperature and usually at saturation pressure. Then, the pressure is reduced in steps at a constant reservoir temperature. The liberated gas first reaches equilibrium with the remaining oil, then it is removed from the cell and flashed to standard conditions. The volume of the two phases are measured and recorded at each pressure level [2].
The above depletion process is repeated at constant reservoir temperature until a pressure close to atmospheric pressure is reached. The figure below shows the schematic of this experiment.
Separator tests are conducted to determine the behavior of the reservoir fluid as it passes through the surface facilities and then into the stock tank.
The reservoir fluid is placed into a cell (a separator) at the reservoir temperature and its saturation pressure. Then, the oil is flashed to the specified separator conditions. When phase equilibrium is reached, the gas is removed from the system, where its volume, gas gravity, and composition are measured. Then, the volume and density of the remaining oil phase are measured. Afterward, this remaining liquid is subject again to the next separator conditions, and the process is repeated [2]. A schematic of a multistage separator test is shown below.

Despite the fact that these PVT experiments capture the real behavior of reservoir fluids, they can be performed only within a limited range of pressures and temperatures. Once the original conditions may change with time and recovery strategies, knowledge of the fluid behavior within a wider range is necessary. In this way, simulations will describe and quantify fluid phase behavior and properties under any conditions.
In the next posts, we will introduce ESSS’s simulation solutions for reservoir and PVT analysis. We will also discuss how simulation software can be used to characterize your fluid. Stay tuned!
[1] Freyss, Henri, et al. “PVT analysis for oil reservoirs.” The Technical Review 37.1 (1989): 4-15.
[2] Ahmed, Tarek. Equations of state and PVT analysis. Elsevier, 2013.
[3] Whitson, Curtis H., and Michael R. Brulé. Phase behavior. Vol. 20. Richardson, TX: Henry L. Doherty Memorial Fund of AIME, Society of Petroleum Engineers, 2000.


